

Get started
Administrate’s reporting engine unlocks data-driven decision making
Access all of your training data, rapidly, and with no limitations.
Administrate uses an advanced reporting engine that gives you complete control over reporting, data analytics, and more.
Administrate has a powerful built-in reporting engine. Because Administrate acts as the single source of truth for all of your training data, it’s easy to create detailed reports that track any metric. This deep dive video, originally a LinkedIn Live, shows you how to use the reporting features in Administrate.
You don’t need a BI tool with Administrate. See how to add filter conditions (including custom fields, relative dates, and groups combined with any or all logic), choose your output columns, add formula columns for things like remaining places or margin, then section and total the results. Every entity and every field is exposed, the same as through the API, and each row drills through to the underlying record.
32:55 watch · 6,165-word transcript
Auto-generated transcript — may contain errors. Tap a timestamp to jump the video.
Alright. Welcome back, everybody. It is another amazing LinkedIn live broadcast directly from our intergalactic headquarters here in Edinburgh. I'm joined with JJ. And today, we're gonna talk about the joys and wonders of reporting. Mhmm. Now this may seem boring to some people, but we are actually really into reporting. And we are excited to do this, and it's gonna be a deep dive into just how we think about reports, how we think about data at administrate, and how we think our customers think about data and should be thinking about data. That's right. So I'm I'm really excited about this. One of the things that is important to understand when discussing topics like data, reporting, analytics, all this kind of stuff is the difference between a point solution and a platform.
Now at administrate, we are sometimes used as a point solution. We don't really like it when that happens because we think we're so much more. But, you know, we tend to be configured or put into configurations with other products within the kind of tech stack that our customers have where we are functioning as a platform, as a system of record where data is moving in and out of our product. And often, there are multiple learning management systems at play to handle e learning. We are, of course, handling the classroom scheduling and the, operational aspects of delivering ILT. But then there are all kinds of other solutions out there, maybe virtual labs, maybe an assessment engine of some kind, probably an HR system, often a CRM.
We've got a whole another set of videos where we talk about integrations and why they're important, and we encourage you to check them out. But because there's all this data flowing around, we've had to get very good over the years of being able to store data that is not native to administrate Mhmm. And also help customers be able to report on data that is not native to administrate. That's right. Because I mean, I think what's important to think about when we say that we're a platform, that all this data comes into us, but then it's not we're not the dead end of where that data just goes and lives. It sits in our system, but then it's being able to use that data from our system to go to all of all of the rest of the things that you use and get it back out there. It's like that pulling together of all of that training data into one place that you can then utilize for your business.
Totally. And I remember many years ago when administrate was just getting started, we did not have what we call today our reporting engine. And in fact, we had a very key customer at the time. They're our largest customer. They're our most sophisticated customer. They had training operations in, like, twenty five countries, and they operate in a franchise model. So the franchisees would need to have reports that were important to them, but they also wanted to roll up. And we were being asked weekly Mhmm. Sometimes daily to build custom reports for this customer Yeah. To get the data that they needed. They were willing to pay. They were paying tens of thousands of dollars to get this work done. And I was like, this just needs to stop. Yeah. And so we said, no more. We're not gonna build any more customer reports.
Instead, we're gonna spend the next year or so investing in a reporting engine. And that's what we wanna take you through on a tour today Yep. And, and show you how this thing works because it's been probably one of the biggest differentiators Mhmm. For us out there in the market. It's been probably our most one of our most popular features. Yep. And, it's a little unusual for a learning product to kind of have this type of power embedded within it that any user can access. Yeah. And so we said no more. We're not gonna build any more customer reports. Instead, we're gonna spend the next year or so investing in a reporting engine. And that's what we wanna take you through on a tour today Yep. And, and show you how this thing works because it's been probably one of the biggest differentiators for us out there in the market. It's been probably our most one of our most popular features.
Yep. And, it's a little unusual for a learning product to kind of have this type of power embedded within it that any user can access. Yeah. That's it. And well, moving on to that then, why is it then, John, that our reporting engine is different to what exists out there? Is it, like, you know, how is it set up differently? How can our users utilize that differently than they can with other products? Well, I thought it would take a lot longer to get an excuse to use my favorite feature. Once again But here we go. We're, we're gonna do it. So, take you to my digital whiteboard. Love this thing. And we kinda sketch out some concepts for you here. So, when we think about reporting, there are various entities within administrate.
And these are things that you would expect, you know, and and I'm oversimplifying, but it could be things like students. You know, we have students. And, you know, we'll have other entities like, maybe a class. Right? And, this is the same for every system. But the way the administrate reporting engine works, and if you're an engineer, you'll recognize this. It's basically a visual SQL, builder. And, so what you do is you start off and you say, okay. I'm interested in students, but I don't want just all students. I want a specific group of students. And so you might say, you know, I want any student that has been registered in the last thirty days because you wanna check a billing status or something along those Yep. Along those lines.
And so what you do is you put in your conditions, your filtering conditions. Right? And these could be things like, you know, greater than or less than in different fields. And and the student's entity will have all the various pieces of data that you're storing against Yep. Those learners or those students. And these fields can be custom fields They can. Which is a very rich feature within administrative Absolutely. Heavily heavily used. Again, this is something that you can set up on your own as a customer. You do not have to submit a support ticket or call us or do anything like that. And actually, we got the question just the other the other day, which was do these cost more money? And no. No. Not only do are custom fields free or part of the subscription that you pay, but also these reports are free and they don't cost you any money. Yep. So I put in my filtering conditions, and it's kind of like I then have this entity of students, but I'm only taking maybe one slice of it.
Right? The folks within the last thirty days. And then what we do is we say, okay, we've got the data that we want. We're now going to figure out which selections of data we would like. Right? So which fields? Mhmm. These are the columns in your report. Right? The rows are gonna be students and the columns are gonna be which fields that I wanna see. And so I may only wanna see first name, last name, and I don't care about their address. So I'm not gonna worry about that. Maybe I care about their invoice status or whatever. Or some of that custom information that you've put in to Exactly. To track that learner. Yep. And then what I'm going to do is I'm gonna take a few of these fields. Right? And I'm going to put some sort of sorting mechanism or grouping Mhmm.
Mechanism. Mhmm. Okay. And this, you know, this stuff, it's not the most riveting of discussions, and it's not the most beautiful of illustrations. You can see it, JJ. No. What a silent judging me, graphic designer here. But the key thing is for most learning products out there on the field today, the kind of decision making starts right around here. And you are limited down to only preselected pieces of data, that somebody else has made the decision around that that's important. And and you are only maybe allowed to select which columns and maybe do some sort of sorting or ordering. Which is extremely limiting.
When you think of all the variant needs that any single customer has for reporting and getting data out, being limited down to the set structure, the set list of information, and not being able to customize that with your own input into the, you know, the various bits of entities that we have with your custom fields, not being able to do that is hugely limiting for the business and being able to do what you need to do, reporting to your team to understand the success of the last month or reporting to your, your higher ups or to, other, you know, awarding bodies for your certification stuff for governing bodies, for various other things. It can be incredibly limiting if you don't have a tool like our reporting engine that really has the flexibility to allow you to get all of that information that's put into the system back out again.
That's right. And, one last really key point is you can do something called a join. Right? Which is basically, in that example I gave before, students who were registered in the last thirty days, maybe who have attended a specific class. Mhmm. Now we're we are needing to grab data from multiple entities. Mhmm. Maybe five, six, seven in some cases, join them together and line them up, and then we do our filtering. Yeah. This is super, super powerful. It means that you can build reports on seemingly, you know, pieces of data that may or may not be logically related at least or the way that we think about it when we're building our product and boil it down, get the data you need in the format that you want it.
And, we'll talk about we can even set up a delivery schedule for how this stuff comes through and and so forth. Mhmm. One question we often get asked, by customers or during the sales process is, well, our company already has a BI solution. Why do I need this? Why is this important? Mhmm. And there's a couple of reasons why we think that this is it's really important for training teams to have control of their data and their reporting. And the first is is that because administrate is an operational platform, teams are living and breathing within our platform Yep. Daily. They are scheduling classes. They are fixing mistakes that happen because of availability problems. They're building out new content and all kinds of things that happen.
A lot of a lot of, money flows through the platform about a quarter of a billion dollars a year right now and growing rapidly, flows through administrate. So all of this stuff needs to be looked at and managed and taken care of. And because it's an operational platform, this data is going to be accurate. One of the big challenges with a BI hookup is you kind of get this data that is stale or hasn't been kind of operationally honed, and you can't necessarily get the data that you want when you want it. Mhmm. The second kind of response to why not just use a BI platform is you should totally use a BI platform. Most of our customers already have one. They will usually have a dashboarding solution that's hooked up to that. But by taking control of which data is fed to the BI platform, the training team can then make changes.
They can double check. They can be confident this data feed is accurate, and they don't need to wait on IT. And we can talk about that down the line as Yeah. Just how that would work. Mhmm. Absolutely. Yeah. So so that all being said, let's actually take a look at reports then now in the system, and we'll do a little walk through and see how what we spoke about translates to the system. So if we just switch over there now, I'm currently on our, report list page. So these are all the reports that I have, in the system. And I'm gonna first then click on my create a new report action here. And you can see when John was talking before about all those different entities in the system, you have them all listed here.
So anything that exists in the system, you're able to start a report looking at that entity. And that's a really, really important point. Right? We get this question all the time because people just don't believe it. And it's kind of like, is it every entity? Or is it every field? It is all there. It's all accessible. We are not limiting any of that. No. Not from our reporting engine and not from our API. Right. Exactly. Yeah. You are in complete control there. So if I, I want to pull up this, report that I was working on and go through it, together. So this is me starting a report with that type of event. So I'm looking at all the events in my system. And as John mentioned before, we start with that entity, and then we go, okay, so how are we gonna filter this entity?
What set of events are important to me for this report? And I've put in a condition here for the start date. And this is a really good one, to to sort of highlight what we're doing here because this is a relative time scale. I'm looking at all of the, events that have started last month. So this is gonna change every month. This report will be consists of a different set of events. Next month, it will be the ones that were this month. And, I'm, you know, setting it up to look at my classrooms. Now if we look at how I've done that, I can add a condition. This is what our filters are. And you can see here again, this is those related entities that John was talking about. So I could go into something to do with the course template that was created, that created this event.
Or I could go into something that was related to the venue. Maybe I'm looking for, the events that run within these vendors, that were in this venue sort of to help with billing, or anything like that. And so you can go into the other entities, or I can go into the event fields themselves, the actual bits of data, that are on the event. So my active students, how many are there? The, the revenue that was pulled in from that event. All of these, including all of your custom fields that are on that event as well. Because you have your own operation, your own data that you track, and you can pull that in here as well as a different filter condition. And so you would add to these filter conditions here, and then select your output columns. So this is the data that I want displayed back to me.
I've done the filter conditions that's, you know, reduced that subset of events that I'm looking for. And now I'm configuring what that report will display as. What information is it gonna give me back? And again, if we just go quickly down this list, we've got a start date here. And you can change the formats of some of the information that you've put in there to suit your needs. You can edit all of these labels to be exactly what you would prefer for your company, and, we've got our active learners. And something with our active, students here is that there's this totals column, which is super useful depending on the type of data that you're pulling in. You're able to then sum some of that data. It could be that we're looking at the total or we're looking at the average. We wanna see how how this particular course on average performed over this period of time.
We could do that. And just another look again, you'll see a very similar thing then when we want to add the column. Again, we've got these event relations, so we can look at specific information that was associated with the venue, or the course, or the price, or anything that was related there. And again, every field that's on the event will show here including your custom field. So you can have all of that custom information in your report after you've done your own custom filtering on that report. So you can see the flexibility here for building exactly what you need for exactly why you need it is, you know, it's unparalleled compared to what other systems are doing. You've got everything at your fingertips here. So it's really powerful stuff.
And so if we just then look back our report, if I go and view this here, again, you can see okay. So I put in my start date, gray. I've got the the course codes. I've got those titles, fantastic. The location, and I've got the active students in there. And you again, you can see up at the top here, this blue bar that's highlighting the totals. So over the last month, here's all of the, events, that I'd run there, and the total learners there is fifty four. A great a useful little report that you can just very quickly, whip out and build, and something that will adapt month on month as I go forward. It's because it's got that relative term. Yeah. And I think I think we've talked about this maybe before in other kind of broadcast, but we have this philosophy at administrate when we're building the product that many of the screens that you'll see us demoing and that we're making updates to are kind of operational in nature.
These are screens that we are opinionated on that we think should work in a certain way. And, you know, they're designed to help you get stuff done as quickly as possible during the day. Then there's kind of the informational piece of our product. And that's where we say, look, if you if you wanna know something, if you need something delivered to you, if you got a a specific a specific piece of business logic that, you wanna be checking on, build a report, and that will be customized to whatever you need it to be. Yep. Now, you know, we do training on this as well. Like, it's it might look a little bit overwhelming at times. Mhmm. But people get the hang of it very, very quickly. And I'd say, like, the average for customers is probably three digits of reports. You know, like, at least a hundred, hundred and twenty.
Absolutely. We will we will provide a few templates through during our implementation process, a kinda ten to fifteen different standard reports. But, you know, folks go nuts on this. Well, I yeah. I think that's the thing. I think as soon as you understand that you are able to do almost anything with this tool, it then becomes, oh, wait. Hang on a minute. I could report on that thing that I've never been able to actually do, and I've had to do several different leaps to get that sort of piece of information that I was looking for. Now you can build all of those reports out, and and they can be they can be varying levels of complexity. You can have a very simple straightforward report like just look at the last month learners for these courses. Or in fact, you could get something that's a little bit more complex where we're doing a little bit more with those filtering conditions.
So what we have here is this concept of groups in the filter conditions. We have our sort of individual filters that you'll remember from the previous one. There's that familiar start date, that relative term looking for the events that are this month, in this case, because I have the zero. But these are contained within a group. And then you'll see that there's the second group underneath that. So what's the difference between these two? Well, the first group is saying, I'm looking at all of the events that happened or that will happen in New Zealand this month. And then this group is saying, I want to look at all of the events that are happening in the United States this month. So those are two separate sets that that, of filter conditions that I want to look at. And you'll notice here the the overall rule that's that's being asked here is I want to find events that match any of the following.
So it's looking at any of these groups. If there's an event that falls under those conditions, it will find it and bring it back into the report that you're looking at. And these groups can go on. You can you can build this filter condition to be really quite complex, as complex as you need it to be. So there's a lot there for being able to get down to the minutiae that often you might need to do for a particular customer to be able to report exactly what they need from the various learners in the various locations. Okay. So you see here on our output columns, there's some familiar faces here once again. But I have an extra column here, which I think I'm in the way for. So I'm gonna very quickly do that, and then I'll explain, and then I'll jump out again, so that I'm not in the way of you being able to see what's happening here.
So, the formula column is something that you can use, to do some basic sort of math, on any of the the the the more sort of numerical data that you have in your report. So you're not limited to just the fields that are in the report themselves, but you are able to perform some operations on those as well. So if I do another shift out of there, you'll see that the, sum that I'm doing on this report, on this here is I'm looking at the max places and I am removing or minusing the active students from it in order to get my remaining places, on the, event, on the report. So it's super useful for being able to, you know, do the sums to find that information.
Another another very common example of using formulas is around things like margin. We have found, you know, a lot of people just think margin is margin. We have found over the years that, customers when they're selling training or costing training or thinking about what it cost to deliver training, think about margin in all kinds of different ways. And, you know, some folks are adding in all the costs and some are like, no. We don't count those costs and all the stuff. And so just even that type of calculation or maybe different teams worry about different aspects of margin, you know, then this type of formula thing is very, very popular. And it and it means again that we can focus our time on building out great infrastructure and a great product to help with the operational challenges.
And you can spend all the time worrying about your business logic and your reporting needs and so forth. And, it just doubles the the amount of Absolutely. Of, you know, effort that that we can put towards these problems and not have to waste time. And and and it depressurizes, the relationship between us and you as a customer because we are not on the hook to deliver reports to you. Mhmm. And, you don't have to pay us money and we don't have to, you know, go down that that spiral. No. So you can see here what we have is, these sections tab that we didn't address before, but it's something that John had mentioned, whereby I'm sectioning this this report based on the location. Okay. So what that means is I'm gonna be able to view this report in terms of, oh, this set of events that was done in New York City, I'm gonna be able to see all of the, available spaces for just New York City in their own section there.
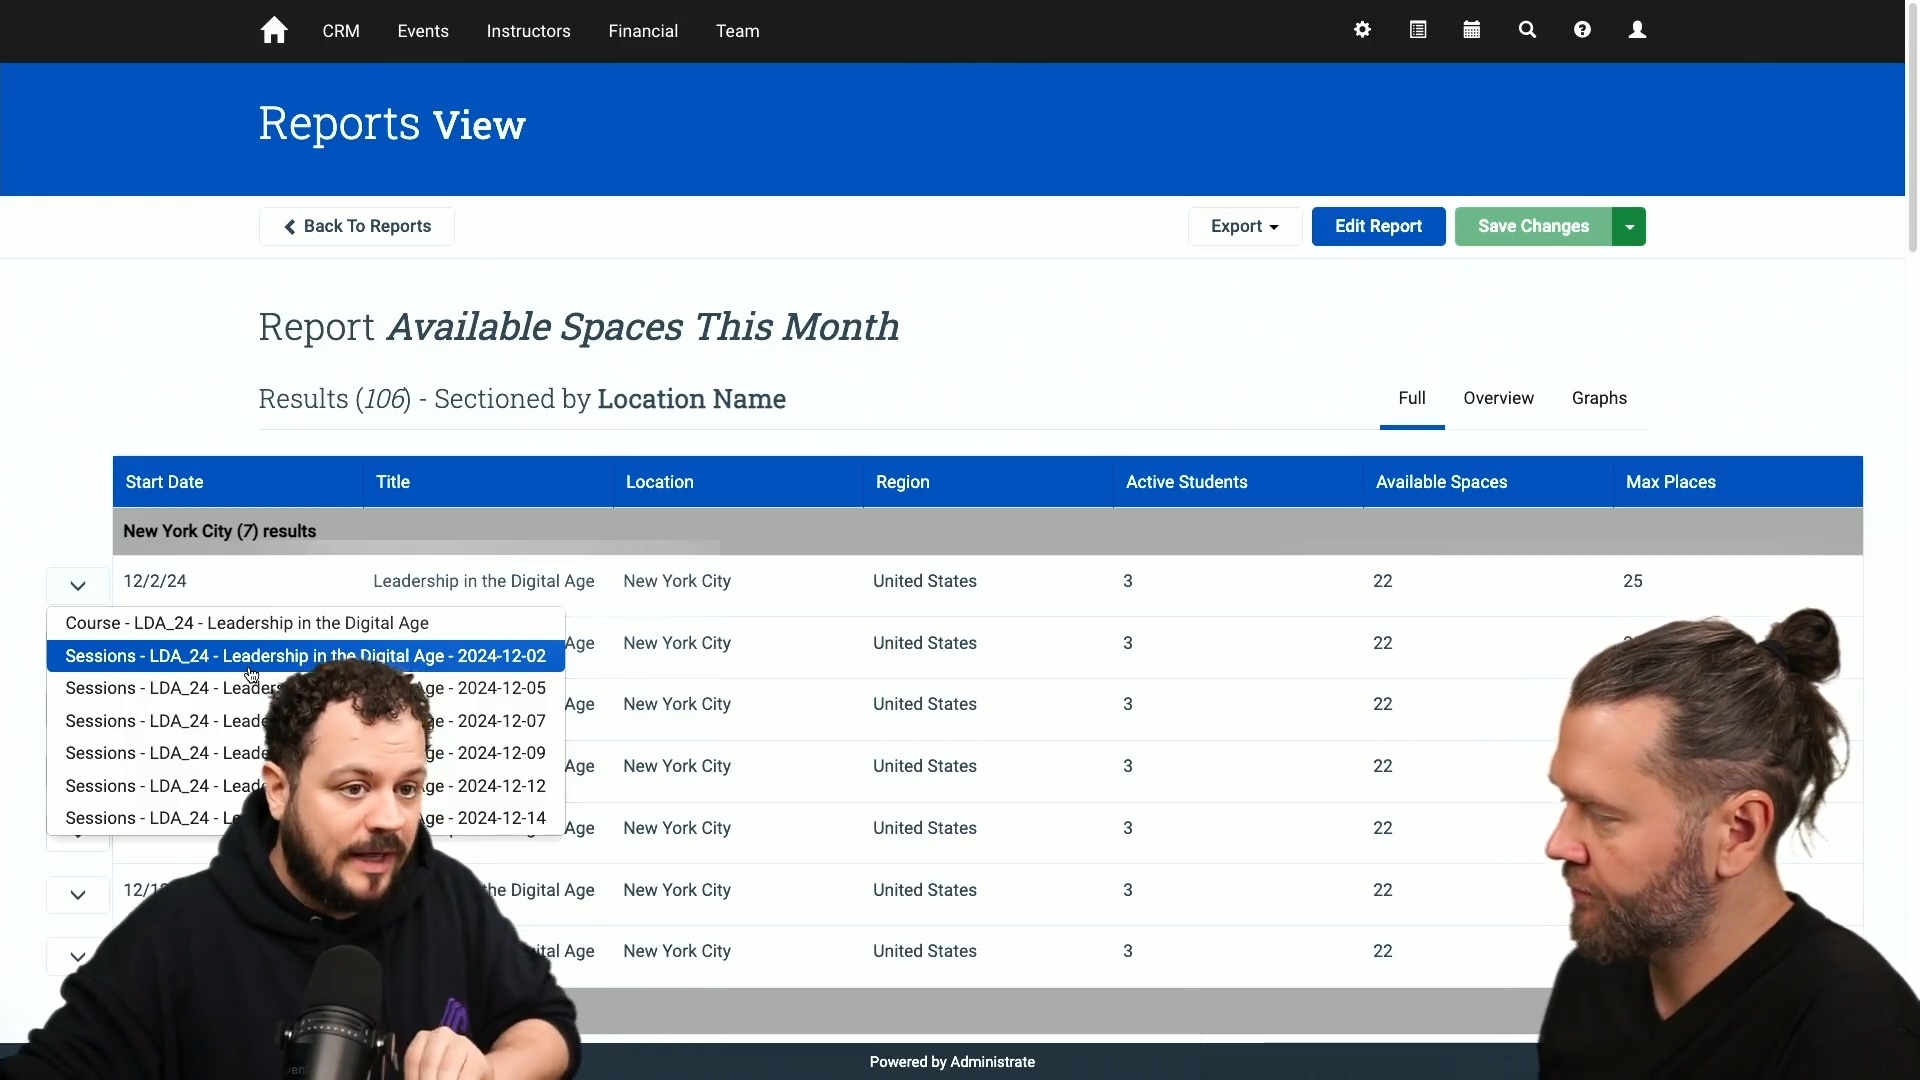
And I'm also going to order those sections, by the start date. So I can go and see in date order, by location, all of the available seats, that, that are in these locations. And if I go and view that report, then I'll be able to see that in action. I can see that this has been grouped by location. I can see that New York City seven results. I can see the various events that are happening, the location, the region, and then I can see my active students, the available spaces, and the max places. Remember that available spaces is a calculated field. That's a formula field that's looking at both the active and max, and then pumping out that available spaces. So then this report, as I then scroll down, I'm seeing based on each of those locations that were either in the States or in New Zealand because that's the ones that I care about for this one.
I can see all of those available spaces for this month, which would be a useful report if we now need to then, you know, get the fill rate up on some of these events, and and get that sort of information out there. That's something that we could use that for. So a couple of questions for you, JJ, as you're going through. Mhmm. What is that carrot thing on the left hand side of each row of the report? Yes. It's a very cool feature. Thank you for asking, John. So what this does is actually very reactive to what you actually have in your report. So we've got the report and we've got the information. But now if I click on this carrot, what you can see is a series of links that relate to the data that I've got in this report. So I can either go to the course template that was used to build this particular role, this event, that was in there.
Or I could go to the event itself. In fact, particular session, I'll be able to go to, and see that information. And that will change depending on what you have in your report. You'll be able to have different actions there, to be able to go straight to the the the item itself in the system. To drill down. To drill down, so to speak. Yeah. No. And these are all added automatically, which is super cool. So when you start relating and joining together entities to build these reports, it will automatically add in the actual underlying data point that is driving the row on that report. That's right. So you can always drill down if you're like, that looks weird. What is going on here? Yeah. You can just blast into the record, drill down, one click, automatically. Very, very cool. Super useful.
You are making these changes and running these reports in effectively real time right now, aren't you? I am. You're not having to wait for Nope. Minutes or hours. I mean, okay. If there's a lot of data and it's a very complex query, it might take, you know, thirty, forty seconds or whatever. But these reports are being run pretty much on demand, and it's it's relatively fast. Mhmm. And, you can and this is one of the, key things that we think is really important for a great reporting engine. And again, it's one of the contrast between shoving all your data into a BI system somewhere. Mhmm. Because if you have to wait five minutes or ten minutes or twenty five minutes to get the results of a query that you're putting towards the system, that discourages exploration, that discourages, a kind of a culture of using data to make decisions.
Mhmm. And so we want you to have the power and feel very comfortable coming in, seeing something that's not quite right, maybe adjusting the report or adding a column to double check something or drilling down and to be doing that really quickly, you know, not having to wait. That's it.
And and something else that we haven't actually touched on is this export action up at the top. So you've you've got some usual suspects, in here. You can, of course, download this report in in CSV or as Excel. This DMS item here is just saving it to your own, file structure within the ministry. You're able to do that here. So you you can pull that report out and you might be thinking at that point, oh, great. Then I can send it off to team lead, for them to be able to get this information. And you can if you want to do it that way. However, that's also a bit manual and slow for us to administrate, and we have a better way for you to be able to do that. So I'm gonna show you that now. I'm gonna go into our control panel, and I'm going to build what we call a communication template.
We've touched on this before in a previous LinkedIn live, so if you haven't seen that and want a bit more about that, please do check that one out. But I'm going to create a new template here, and this is just gonna be the update. The update template that I'm going to send to, my staff. And I'm gonna select this scheduled item. And that's very important for what I'm about to do. I'm just going to fire in some basic information here. Here are the reports. That's not how you spell. There we go. Reports, boss. You're a bit of an angry typer. I am. Yeah. I do kinda slap them on that keyboard. So now, if I go to add attachments and I go into this is the DMS that I just mentioned before.
This is the internal file structure that you can create on administrate to store various documents. And I can go into event, documents here. These two reports are this is where I save those two reports that we just went through. So I'm actually gonna add this report as an attachment to this, document and to this email template rather. And I'm gonna add the second one onto that email template as well. So I've got both of those reports that we just went through because every month, I wanna send this to my team so that they know what happened last month and what are the available spaces for the the events coming up this month, which is gonna be super important information for my team to know. And you don't wanna have to remember to do it. I don't wanna have to remember to do it. I don't wanna have to go into that report every first of the month and export it and then build bring up the email to send to my team again.
That just seems like work I don't wanna do. So I've built that template, that email template now, and then here is the great part. I'm gonna I'm gonna set the the trigger for it. I'm gonna set this thing to fire off. So again, I'm gonna fire in update. And then here is the target. There's that scheduled, item again. So this is saying for this target, this this is gonna send an email at a point in time. A point in time that I will determine, which is determined by this this frequency piece down here. So if I just go into this frequency piece, I'm gonna wanna send that monthly and I'm gonna send it on the first day of the month. And I can fire in, you know, my emails here. So there's boss boss boss man, company, dot com.
We'll forgive the spelling for me going through this quickly. Thank you all. And so we have that there. Fill out the the rest of our information, and select the update template. So here's my update template in there. Now what this will then do is when I have saved that that trigger, and, you know, committed that, on the first of every month, it's going to generate that report. And remember, these reports were relative start dates. So every month, it's going to update for what is the the new last month and the new current month, and then send that information out to all of the emails that I put in here. And really, the possibilities at that point for getting the information to your team really are endless because you can have all of these different emails templates set up with the various different reports for the various different stakeholders.
It could be your customers. It could be your teammates. It could be your higher ups, whoever it might be. Yeah. Very important point here. These recipients do not have to be users of administrate. That's right. They don't have they they don't even need to know that administrate exists. Nope. Right? It's just any email address you can send out this information to, and it will be delivered as an attachment. Yep. Or if your security settings require them to log in, you can do that too. Yeah. I mean, it it it yeah. That's it. It's It could even be your instructors. You're sending up here's the the next set of courses. Just a reminder, by the way. Here's the rest of the courses that are on this month, or it's like you say, it's someone else that exists outside of the system. It doesn't matter where they are. If you've got their email, you can send it to them automatically every month. Yeah. And this is great for even just sending things to finance teams.
You know, here's all the stuff that we build last month, and you it just removes an entire class of headaches. Mhmm. Not only in getting the data, not only in preparing the data, but just sending it out as scheduled. That's right. Super powerful, and customers love this feature. We have covered a lot of stuff in a short amount of time. But I would encourage you, get in touch, ask us questions about this, what have we missed, and so forth. Reporting is such a fundamental piece of running a high quality training operation, not only just for ILT, but also for the selling of training. Yep. If you do that for the nagging of people to come and do their training, if you do that. And it it really it's one of those things that I think, has been a bit sorrowful over the last few years in some cases as customers kind of come on board and they realize what they were missing Mhmm.
Previously. And so, it's a it's a bit sad on the one one hand, but it's actually really great to see customers latch onto this and just get so much value out of a a feature that, you know, we have had for years and years and years We have. And in some cases, take for granted. Yeah. So, yeah, reporting is really great. You can build reports. Anybody can build reports. Anybody can view those reports. You can distribute those reports. You can distribute them on a scheduled basis. And it's, it's it's super powerful. And, we'd we'd love to to show you more on a demo. If you have any interest in, seeing what an administrator could do for you, definitely get in touch. So my name is John. And I'm JJ.
JJ, and, we hope you enjoyed it, and we'll see you again soon. Thanks, folks.